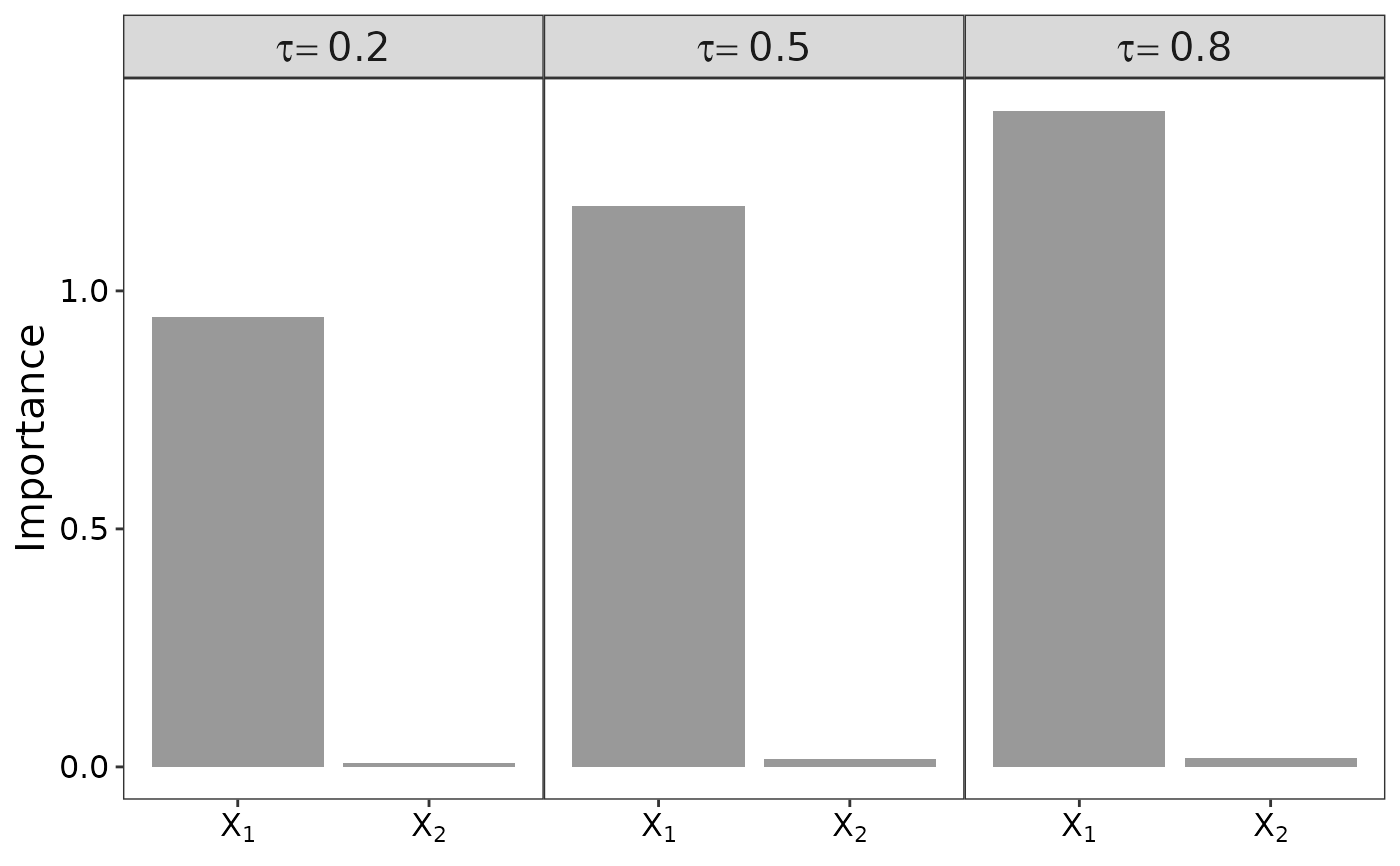
Computes the quantile ALE-induced variable importance (VI) measure for each of the covariate specified in var.index, and produces a ranking plot of the covariates using bar plot for each quantile of interest.
Arguments
- object
An object of class
SPQR.- var.index
A vector specifying the index of the covariates for which VI measures should be computed. Default is
NULLindicating all covariates are considered.- var.names
The names of the covariates to appear in the bar plots. Default is
NULLand the the function will use generic names generated byparse(text=paste0("X[",var.index,"]")).- ...
Arguments passed on to
QALEtauThe quantiles of interest.
n.binsthe maximum number of intervals into which the covariate range is divided when calculating the ALEs. The actual number of intervals depends on the number of unique values in
X[,var.index]. Whenlength(var.index) = 2,n.binsis applied to both covariates.ci.levelThe credible level for computing the pointwise credible intervals for ALE when
length(var.index) = 1. The default is 0 indicating no credible intervals should be computed.pred.funA function that will be used instead of
predict.SPQR()for computing predicted quantiles given covariates. This can be useful when the user wants to compare the QALE calculated using SPQR to that using other quantile regression models, or maybe that using the true model in a simulation study.
Examples
# \donttest{
set.seed(919)
n <- 200
X <- matrix(runif(n*2, 0, 2), nrow = n, ncol = 2)
Y <- rnorm(n, X[,1]^2, 0.3+X[,1]/2)
control <- list(iter = 200, warmup = 150, thin = 1)
fit <- SPQR(X=X, Y=Y, n.knots=12, n.hidden=5, method="MCMC",
            control=control, normalize=TRUE, verbose = FALSE)

## compute quantile VI of at tau = 0.2,0.5,0.8
plotQVI(fit, tau=c(0.2,0.5,0.8))

# }
# }