Computes the predicted values for different functions based on the fitted "SPQR" object.
Arguments
- object
An object of class
SPQR.- X
The covariate vector/matrix for which the predictions are computed.
- Y
The response vector for which the predictions are computed. Default is
NULLindicating that a equi-distant grid vector on [0,1] of lengthnYis used.- nY
An integer number indicating length of grid when
Yis not specified. Default: 101.- type
The function to be predicted;
"PDF": probability density function,"CDF": cumulative distribution function, and"QF": the quantile function (default).- tau
The grid of quantiles for which the quantile function is computed. Default:
seq(0.1,0.9,0.1).- ci.level
The credible level for computing the pointwise credible intervals. The default is 0 indicating no credible intervals should be computed.
- getAll
If
TRUE, extracts all posterior samples of the prediction. Default:FALSE.- ...
Other arguments.
Examples
# \donttest{
set.seed(919)
n <- 200
X <- rbinom(n, 1, 0.5)
Y <- rnorm(n, X, 0.8)
control <- list(iter = 200, warmup = 150, thin = 1)
fit <- SPQR(X = X, Y = Y, method = "MCMC", control = control,
normalize = TRUE, verbose = FALSE)
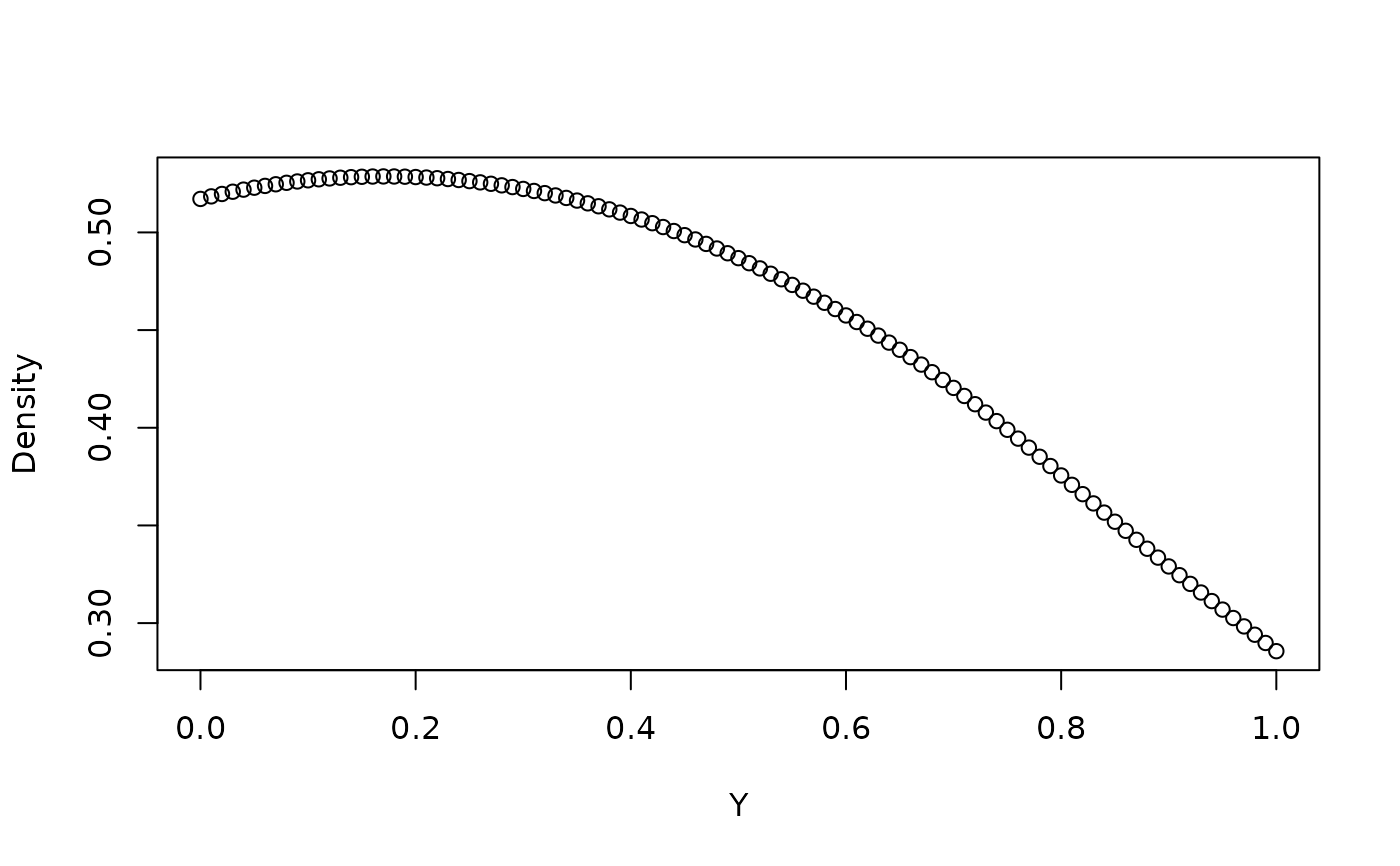
## compute the estimated PDF of Y conditioned on X = 0
pdf <- predict(fit, type = "PDF", X = 0, Y = seq(0, 1, 0.01))
plot(seq(0, 1, 0.01), pdf, xlab = "Y", ylab = "Density")
 # }
# }